Business Data Analytics Explained: The Ultimate 2026 Guide
In the modern corporate ecosystem, data is frequently heralded as the “new oil”. However, crude oil holds virtually no economic value until it is extracted, refined, and distributed. Similarly, corporate databases overflowing with numbers, PDF invoices, and static reports are worthless without proper interpretation. This is exactly why the concept of business data analytics explained has become one of the most highly searched queries among C-suite executives in 2026.
According to comprehensive research by McKinsey & Company, organizations that effectively harness data analytics are 23 times more likely to acquire new customers and 19 times more likely to maintain high profitability compared to their intuition-driven competitors.
Yet, for many organizations, analytics remains an intimidating “black box” filled with complex mathematical algorithms and convoluted code. In this definitive guide, we will break down these barriers. We will provide business data analytics explained in actionable terms, ensuring you understand how to transition your company from a chaotic repository of raw documents into a streamlined, profit-generating machine using modern extraction and automation tools.
Table of Contents
- 1. Definition: What is Business Data Analytics?
- 2. The 4 Evolutionary Stages of Analytics
- 3. The Business Value: ROI and Statistics
- 4. Infrastructure: Building the Data Pipeline
- 5. The “Dark Data” Problem & PDF Extraction
- 6. Real-World Case Studies (Finance & Operations)
- 7. The Tech Stack: From SQL to API Solutions
- 8. Future Trends: Generative AI in Analytics
- 9. Data Governance and Ethics in 2026
- 10. Common Pitfalls: Why Analytics Projects Fail
- 11. The Human Element: Rise of the “Data Translator”
1. Definition: What is Business Data Analytics?
To ensure we have a solid foundation regarding business data analytics explained, we must start with a clear definition. Business data analytics is the discipline of combining IT technology, statistical methods, and overarching business strategy to investigate past corporate performance and predict future market trends.
It is crucial to note that this is not merely about creating aesthetically pleasing charts in Microsoft Excel. It is a continuous, iterative process designed to answer three fundamental executive questions:
- What happened in our business?
- Why did it happen?
- What should we do tomorrow to maximize revenue?
It is also important to delineate the difference between related fields. Data Science focuses on inventing the algorithms and models. Business Analytics, on the other hand, takes those algorithms and applies them to solve specific commercial problems such as optimizing supply chain logistics or automating credit scoring. For a deeper understanding of why merging these systems is vital, read our guide on why integrate data analytics.
2. The 4 Evolutionary Stages of Analytics
Any comprehensive guide focusing on business data analytics explained must include the industry-standard classification model proposed by research firm Gartner. Organizations typically evolve through four distinct stages of analytical maturity.
Stage 1: Descriptive Analytics
This answers the question: “What happened?” It relies entirely on historical reporting. For instance, a dashboard showing that Q3 revenue dropped by 10% is descriptive. It states the facts but offers no context. Discover how to automate these historical metrics in our article explaining what is report generation.
Stage 2: Diagnostic Analytics
This answers the question: “Why did it happen?” Here, analysts dig deeper by correlating diverse datasets. They might discover that the 10% revenue drop was caused by a key supplier delaying raw materials, which subsequently caused a massive inventory stockout.
Stage 3: Predictive Analytics
This answers the question: “What is likely to happen in the future?” At this stage, Machine Learning (ML) models are deployed. Based on historical supplier delays, seasonal trends, and global economic indicators, the system predicts with an 85% probability that another stockout will occur in Q4.
Stage 4: Prescriptive Analytics
This answers the ultimate question: “What action should we take?” This is the pinnacle of the evolution. The AI does not just warn of a problem; it generates a mitigation strategy. For example: “Reallocate 30% of your purchasing budget to Supplier B immediately to avoid the projected Q4 stockout”.
3. The Business Value: ROI and Statistics
A common executive pushback is questioning the initial capital required to build these systems. To properly provide business data analytics explained, we must look at the undeniable Return on Investment (ROI).
- Cost Reduction: Automating data ingestion and analysis pipelines routinely reduces operational expenses by 15% to 20% in the first year alone.
- Eliminating Human Error: Studies show that manual data entry into spreadsheets has an error rate of roughly 4%. At an enterprise scale, “fat-finger” errors result in millions of dollars in lost capital and audit fines.
- Velocity of Decision Making: Organizations utilizing real-time analytics can pivot marketing strategies, adjust dynamic pricing, and reroute logistics in hours rather than waiting for month-end reports.
Transitioning from “gut-feeling” leadership to a truly “Data-Driven” culture is no longer a luxury; it is a fundamental requirement for survival in the 2026 marketplace.
4. Infrastructure: Building the Data Pipeline
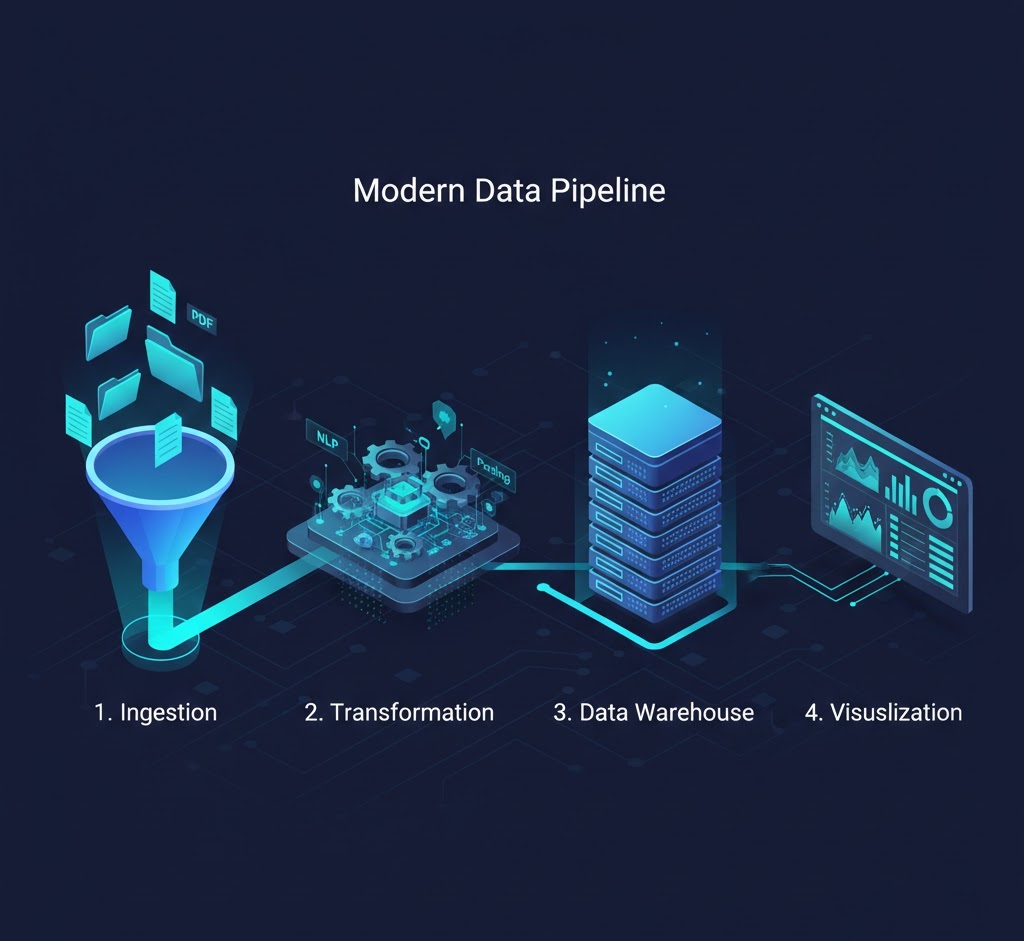
The foundation of any successful strategy lies in the IT infrastructure. You cannot perform meaningful analytics if your data is siloed across disparate, disconnected systems. The technical side of business data analytics explained heavily relies on constructing a “Data Pipeline”.
Step A: Data Ingestion
This is often the most challenging phase. Data lives in CRMs (Salesforce), ERPs (SAP), and most problematically in external, unstructured files like PDFs and emails. Utilizing Application Programming Interfaces is critical here. Learn more in our breakdown of the role of API in automation.
Step B: Extract, Transform, Load (ETL)
Raw data is inherently dirty. It contains duplicate entries, mismatched date formats, and typos. ETL tools clean and standardize this information. If you skip this step, you fall victim to the “Garbage In, Garbage Out” paradox. (Read more about maintaining integrity in data quality in automation).
Step C: Data Warehousing
Once cleaned, the data is loaded into a centralized, cloud-based repository, such as Snowflake, Amazon Redshift, or Google BigQuery. This serves as the “Single Source of Truth” for the entire enterprise.
Step D: Business Intelligence (BI) Visualization
Finally, BI tools like Tableau, Looker, or PowerBI connect to the data warehouse to render the complex numbers into interactive, easily digestible visual dashboards for the leadership team.
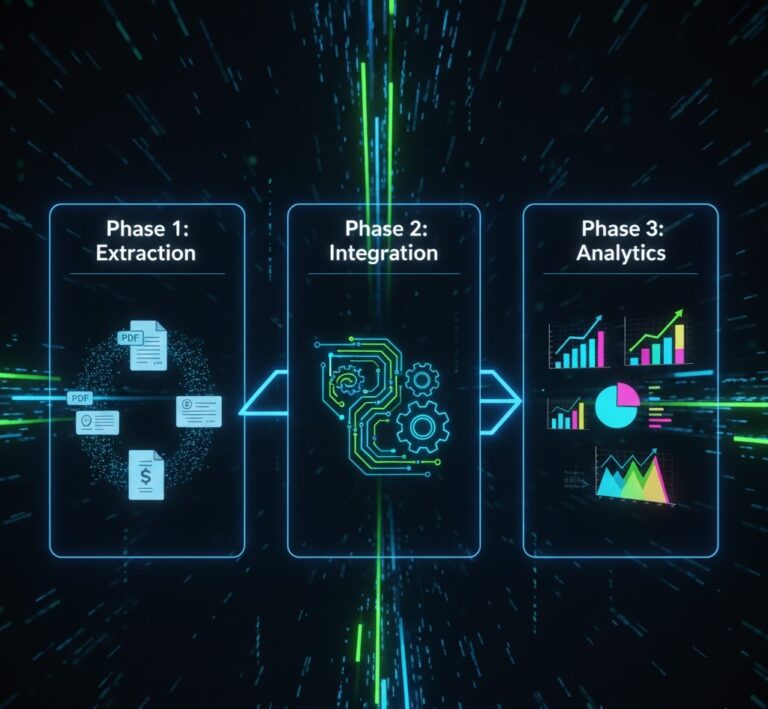
5. The “Dark Data” Problem & PDF Extraction
A critical barrier that is often ignored when seeking business data analytics explained is the concept of “Dark Data”. This refers to the massive volumes of highly valuable operational data trapped inside unstructured formats. You cannot upload a scanned PDF vendor invoice directly into an SQL database.
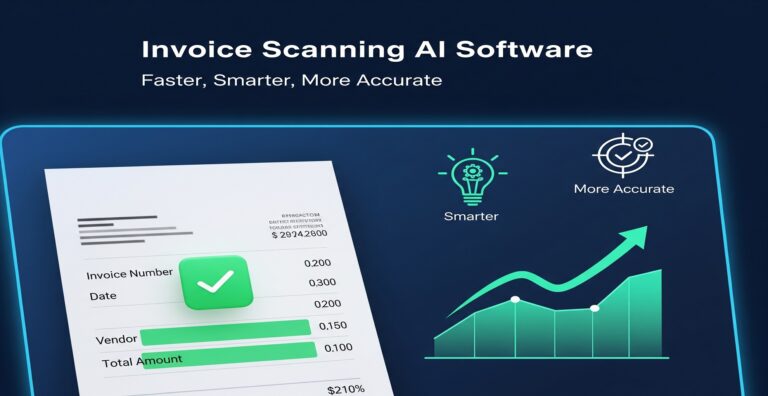
For analytics to function comprehensively, organizations require specialized AI extraction tools like ParserData. These systems act as a bridge: they utilize computer vision and Natural Language Processing (NLP) to “read” static documents, extract crucial variables (e.g., total amounts, dates, line items), and automatically push them into the data warehouse as structured JSON files.
Without this extraction layer, up to 80% of your business data remains invisible to your analytics engine. Discover the mechanics of this process in our comprehensive guide on how to extract data from documents.
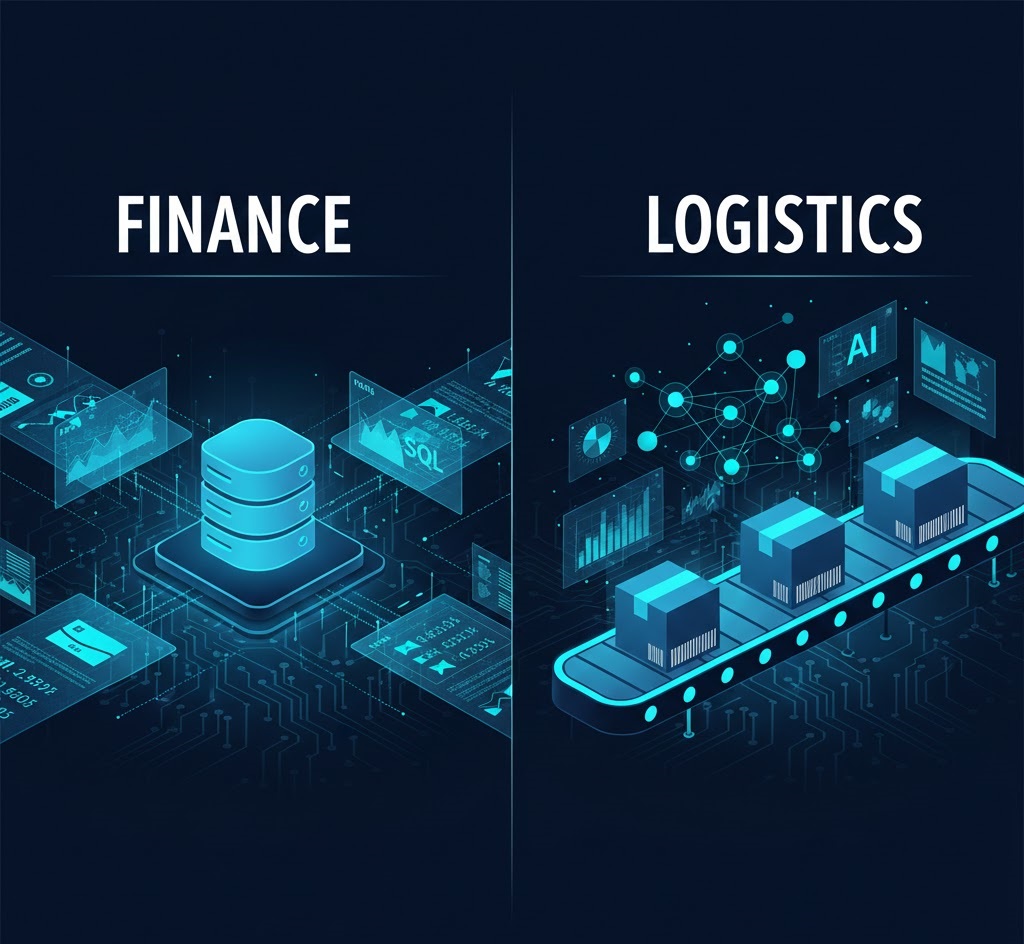
6. Real-World Case Studies (Finance & Operations)
Theoretical frameworks are helpful, but to truly have business data analytics explained, we must observe it in action. How are leading enterprises applying these principles to generate tangible ROI? Let’s explore two distinct business units.
Case Study A: The Corporate Finance Department
A global logistics company struggled with their Accounts Payable (AP) and financial forecasting. They processed over 10,000 invoices monthly, relying on manual data entry. Because the data was trapped in static PDFs, their analysts could not accurately predict monthly cash flow, leading to expensive short-term borrowing.
- The Intervention: The company integrated an extraction API to automatically parse the invoices. This transformed unstructured documents into a live, querying SQL database.
- The Analytics: With structured data flowing instantly, the BI tool identified that 12% of their payments were duplicate bills, and they were missing out on $200,000 annually in early-payment vendor discounts.
- The Result: By combining extraction with diagnostic analytics, they completely overhauled their AP department. For a deep dive into this specific financial workflow, read our legal invoice AI automation guide.
Case Study B: Supply Chain Operations
An e-commerce retailer faced constant inventory imbalances too much winter stock in warm regions and not enough in cold ones. When we look at business data analytics explained in logistics, it is all about predictive modeling.
They fed historical sales data, weather patterns, and shipping times into a predictive ML model. The system began generating prescriptive alerts, automatically telling regional managers exactly how many units to order and when. This data-driven approach reduced warehousing costs by 18% and increased overall sales conversions by ensuring product availability.
7. The Tech Stack: From SQL to API Solutions
When you hear business data analytics explained by IT professionals, they focus heavily on the “Tech Stack.” You do not need to be a programmer to understand the ecosystem, but you must know how to choose the right tools. In 2026, the strategy typically comes down to “Build vs. Buy”.
The Traditional “Build” Approach
Historically, building an analytics pipeline required hiring expensive Data Engineers. They would write custom Python scripts to scrape data, build complex SQL databases, and use heavy enterprise software to visualize it. This approach takes months to deploy and requires constant, expensive maintenance when source documents (like vendor invoice layouts) change.
The Modern “Buy” (API) Approach
Today, agile companies use headless APIs and low-code integrators. Instead of building an OCR engine from scratch, you simply plug into a service like ParserData. The API handles the heavy lifting of machine learning and returns clean data instantly.
| Factor | Traditional In-House Build | Modern API Ecosystem |
|---|---|---|
| Initial Investment | High ($50,000+ in Dev salaries) | Low (Pay-per-use API model) |
| Time to Value | 3 to 6 Months | Days to Weeks |
| Maintenance Burden | High (Engineers must fix broken code) | Zero (Vendor updates the AI models) |
| Scalability | Limited by internal server capacity | Infinite (Cloud-native elasticity) |
Table: Comparing analytics implementation strategies in 2026.
For more insights on integrating external data feeds into your spreadsheets seamlessly, review our guide on the PDF to Excel invoice converter.
💡 Pro Tips for Implementing Analytics
To ensure your investment does not become another failed IT project, follow these three essential rules for executing a data strategy.
Tip 1: Never Automate a Broken Process
If your internal data collection is chaotic, applying AI will only generate wrong answers faster. Before analyzing your data, standardize your input templates. If you are unsure where to start, audit your paperwork using our list of 25 types of business documents to automate.
Tip 2: Empower “Citizen Developers”
You no longer need a PhD in Data Science to build a dashboard. Provide your operational managers with low-code tools (like Microsoft PowerBI and Zapier). By connecting simple APIs, your front-line workers can build their own analytics pipelines tailored to their specific daily needs.
Tip 3: Focus on Data Quality Over Quantity
Having 10 terabytes of unverified data is worse than having 1 gigabyte of highly accurate data. Implement strict validation rules during the “Ingestion” phase. Learn how to maintain high fidelity in our article on automation best practices.

8. Future Trends: Generative AI in Analytics
The final chapter of business data analytics explained must address the future: Generative AI. We are shifting from a “Dashboard Era” to a “Conversational Era”.
In the near future, executives will not need to click through complex Tableau filters. Instead, they will simply type a natural language prompt into their system: “Why did our logistics costs increase in Q2, and what is the optimal shipping route for Q3?”
The Large Language Model (LLM) will instantly query the structured data warehouse, analyze the variables, and generate a plain-text strategic report alongside a custom chart. However, this magical future is only possible if your underlying data is structured, clean, and accessible via APIs today.
9. Data Governance and Ethics in 2026
As we continue to have business data analytics explained, we must address a critical component that can make or break an enterprise: data governance and AI ethics. Having a massive data warehouse is a significant competitive advantage, but it also presents a massive liability if not managed correctly.
When modern executives search for business data analytics explained, they are increasingly concerned with compliance. With the tightening of global regulations like GDPR, CCPA, and new AI-specific frameworks in 2026, you must ensure that your data extraction and analysis pipelines are secure. For instance, feeding sensitive customer contracts or invoices into a public, unsecured LLM is a major compliance violation.
By keeping your data pipeline private and using secure, stateless APIs like ParserData for document extraction, you mitigate these risks. Understanding business data analytics explained means understanding that true data power comes from ethical, secure, and transparent data handling. (For more on maintaining clean and compliant records, revisit our guide on data quality in automation).
10. Common Pitfalls: Why Analytics Projects Fail
To fully comprehend the depth of business data analytics explained, it is equally important to understand why so many digital transformation projects fail. Here are the top three traps to avoid:
- Automating Bad Processes: Having business data analytics explained to your IT team will not fix a fundamentally broken business model. If your underlying data collection workflow is flawed, analytics will simply generate wrong answers faster. Standardize your operations first.
- Siloed Information: A comprehensive strategy requires centralized data. If your marketing team uses one platform and finance uses another without cross-communication, any guide on business data analytics explained will fail to deliver macro-level results. You must integrate these systems via APIs.
- Ignoring “Dark Data”: As mentioned earlier, leaving PDF documents out of your SQL databases leaves massive blind spots in your financial forecasting. You cannot consider your business data analytics explained and complete until unstructured document data is converted into actionable, structured metrics.
11. The Human Element: Rise of the “Data Translator”
Finally, as we conclude our deep dive into business data analytics explained, we must highlight the human element. The most advanced AI and cloud databases in the world are entirely useless if the insights are not effectively communicated to decision-makers.
This gap has led to the rise of the “Data Translator” a professional who understands both the technical architecture and the commercial goals. When a Data Translator delivers a presentation on business data analytics explained to the board of directors, they do not talk about API endpoints or JSON structures; they talk about revenue growth, cost reduction, and market expansion.
The ultimate goal of getting business data analytics explained is not to build better technology, but to build a better, more profitable business. Equip your human talent with the right automated extraction tools, and the data will do the rest.
Conclusion: Your Data is Your Destiny
If there is one key takeaway from having business data analytics explained, it is this: data alone is a liability; analyzed data is an asset.
Companies that continue to rely on manual data entry, PDF document hoarding, and gut-feeling management will be outperformed by leaner, more intelligent competitors. The transition begins with liberating your “Dark Data”. By utilizing advanced extraction APIs, you can funnel previously unreadable documents directly into your analytical engines.
Stop letting valuable insights sit idle in filing cabinets and email attachments. Unbundle your data, connect your systems, and start treating your information as your most valuable corporate asset. Try the ParserData API today to start structuring your documents for ultimate analytical power.
Frequently Asked Questions
What is business data analytics in simple terms?
To have business data analytics explained simply: it is the process of using software technologies, statistical methods, and AI to extract meaningful, actionable information from raw business data in order to make more profitable and efficient executive decisions.
What is the difference between Data Science and Business Analytics?
Data Science focuses heavily on the technical creation of algorithms, predictive models, and machine learning architectures (how it works). Business Analytics focuses on applying those specific models to solve real-world commercial problems, such as pricing optimization or supply chain efficiency (why it matters to the bottom line).
What tools are used in business data analytics?
A modern tech stack encompasses several layers. It includes visualization software (Tableau, PowerBI), scalable cloud data warehouses (Snowflake, Google BigQuery), data extraction tools and APIs (like ParserData), and programming languages (Python, SQL) for custom data manipulation.
How does data analytics reduce operational costs?
A core component of business data analytics explained is cost reduction. Analytics highlights inefficient internal processes. For example, by structuring and analyzing accounts payable data, companies can quickly reveal duplicate vendor payments, hidden fees, or missed early-payment discounts that automation can instantly eliminate.
Can you analyze unstructured data like PDFs?
Yes, but not natively. By utilizing modern AI and extraction APIs, companies can convert unstructured formats like scanned PDFs, emails, and paper contracts into highly structured JSON or CSV formats. Once extracted, this data seamlessly enters the warehouse, making it fully scannable for enterprise analytics.
Recommended Reading
- The Role of API in Automation: The Nervous System of Business
- Data Quality in Automation: The Hidden Key to ROI
- 8 Powerful Steps to Master AI-Powered Data Extraction
- What Is Excel Automation? The Ultimate Guide
Disclaimer: All comparisons in this article are based on publicly available information and our own product research as of the date of publication. Features, pricing, and capabilities may change over time.